
TL;DR
Run the same tasks through different harnesses and you get very different bills, pass rates, and wall-clock times. FrontierHarness v1.0 covers software development and terminal-based tasks.
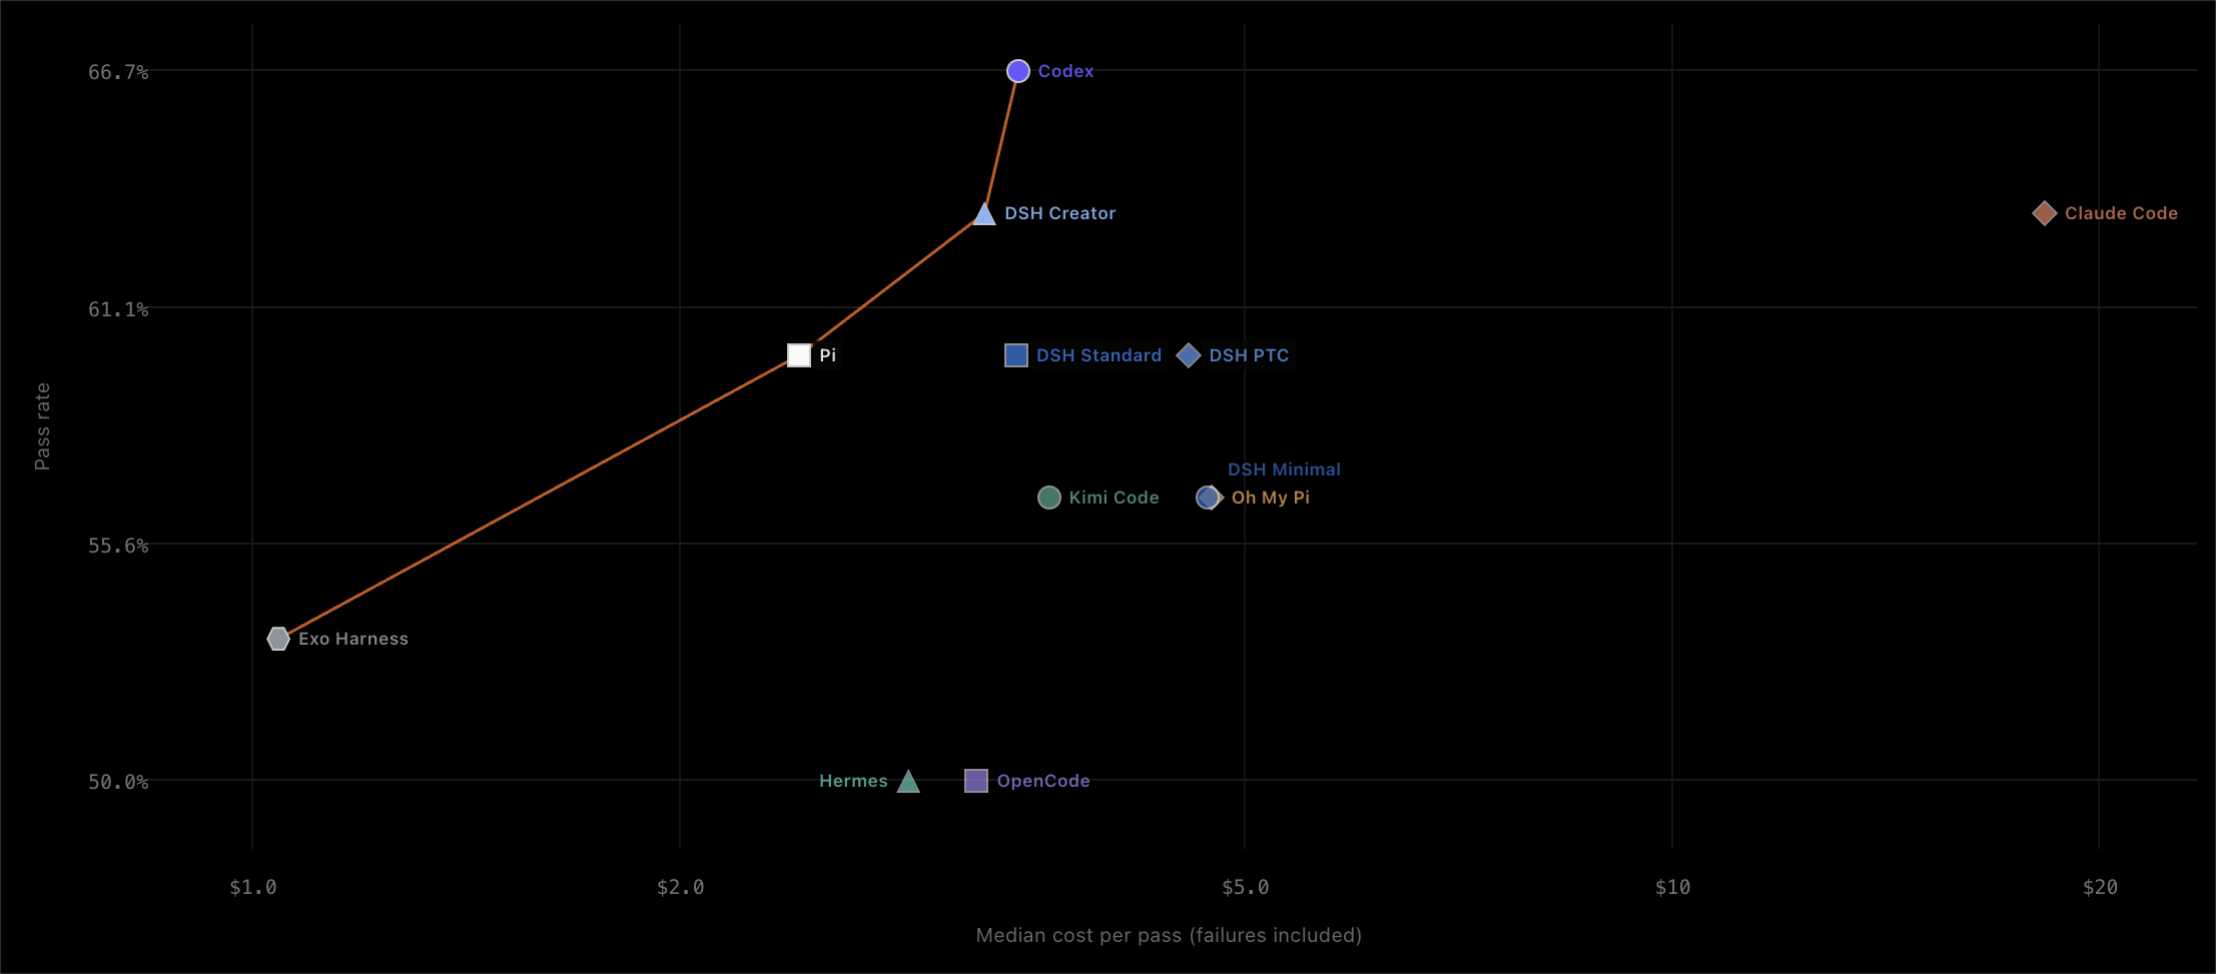
Claude Code and DSH (DeepSeek Harness) Creator both landed at a 63% pass rate. Claude Code paid 5.6x more per pass to get there.
If you want a quick decision, pick based on what matters most to you:

Quality Leader: Codex
66.7% pass rate · $3.47 per pass

Balanced Pick: Pi
60.0% pass rate · $2.43 per pass

Cost Leader: Exo Harness
$1.05 per completed task · 53.3% pass rate

Speed Leader: DSH Minimal
5m 41s median runtime · 56.7% pass rate
Full leaderboard at frontierharness.org. Explore the source data and task definitions on GitHub.
Results
Across all 360 cells: 209 successes, 151 failures. Field-wide pass rate is 58.1%; field-wide token-weighted cache hit rate is 92.4%.
The pass rates for all 12 configurations are close, ranging from 50.0% to 66.7%, just a 17-point difference. But the cost per completed task varies much more, from $1.05 to $18.34 on the same tasks. That means two harnesses can solve the same problem, but one might cost over ten times more than the other.
| Harness (configuration) | Median cost per pass | Pass rate | Cache hit | Median time |
|---|---|---|---|---|
| Codex | $3.47 | 66.7% | 88.0% | 6m 43s |
| DSH Creator | $3.28 | 63.3% | 84.3% | 6m 44s |
| Claude Code | $18.34 | 63.3% | 67.8% | 9m 38s |
| Pi | $2.43 | 60.0% | 79.4% | 7m 33s |
| DSH Standard | $3.46 | 60.0% | 86.5% | 6m 17s |
| DSH PTC | $4.58 | 60.0% | 87.2% | 7m 44s |
| Kimi Code | $3.65 | 56.7% | 88.0% | 7m 56s |
| DSH Minimal | $4.72 | 56.7% | 84.6% | 5m 41s |
| Oh My Pi | $4.75 | 56.7% | 82.2% | 6m 46s |
| Exo Harness | $1.05 | 53.3% | 70.3% | 6m 17s |
| Hermes | $2.90 | 50.0% | 85.9% | 6m 58s |
| OpenCode | $3.24 | 50.0% | 78.4% | 6m 27s |
Initially sorted by pass rate. Click any column header to sort by a different column.
Exo Harness and Pi solve tasks for a fraction of what the rest of the field spends. Codex and DSH Creator show that efficiency and quality are not opposed: both sit near the top of the pass-rate column while spending close to the field median. Claude Code marks the other end. It passes as many tasks as DSH Creator and pays 5.6x more per pass to do it. As discussed below, that result may reflect the interaction between the harness, model, and gateway rather than the harness alone.
Three patterns are worth pulling out:
- Finishing a task and finishing it cheaply are separate skills. Claude Code and DSH Creator both pass 19 tasks. One costs $3.28 per pass, the other $18.34.
- Cache hit rate is not cost. A cached 300-turn failure can still burn more than a short cache miss. Steps and tokens are what you pay for; caching only changes the unit price.
- Vendor lineage did not produce an advantage here. Kimi Code, made by the same lab as the model, tied for seventh on pass rate at 56.7% and sat mid-pack on cost.
Comprehensive harness evaluation
9 harnesses and 12 configurations focused on software engineering scenarios and terminal-based tasks with model, tasks and runtime all kept constant
Identical cold start on every run
All 360 trials are fresh restores of the same checkpoint down to memory state, and no benchmark task was ever run before the formal evaluation because a debug run leaves the prefix cache warm for hours
Neutral evaluation with no home-field advantage
Kimi K3 was chosen as the model to ensure no harness had a home-field advantage, except for Kimi Code, which is built by the same lab
Why we built FrontierHarness
Runta is an agent execution layer designed for token efficiency, secret protection, and governed access. What we care about is how much compute it takes an agent to finish a task it is already capable of finishing, and how much of that is the harness’s doing rather than the model’s.
Model evaluations establish the baseline capability. The harness supplies the tools and environment, and it determines how much of that capability is spent on the problem versus on overhead.
Three questions shaped the evaluation:
- What does a task actually cost? Tokens and steps, measured directly from each trajectory. This is the number we care most about.
- What does a failure cost? Agents spend the most money on the problems they cannot solve. A cost metric that only counts successes hides the majority of the bill.
- How efficiently does a harness use tools? Effective tool calls reduce unnecessary steps, improve accuracy, and save tokens.
How we built FrontierHarness
Benchmark scope
The harness benchmark covers 30 tasks (21 Terminal-Bench tasks and 9 DeepSWE tasks) across 9 harnesses. These run in 12 configurations for 360 total evaluations, with one canonical result for every task and harness-configuration pair. Outcomes use deterministic verifier-based pass/fail scoring, and first-turn cache reads are repriced consistently across harnesses to make costs comparable.
The execution model
Every harness and every task environment is installed once and captured as a golden Runta checkpoint. Each of the 360 trials is a fresh restore from that checkpoint: identical vCPU, memory, disk size, disk contents, and memory state. No trial inherits filesystem drift, a warmed page cache, or a partially-installed dependency from the trial before it.
A few rules make the numbers comparable:
- Benchmark tasks are never run before the formal evaluation. Implicit prefix caching means a debug run leaves the trajectory warm for hours. All debugging happens on a separate smoke task set.
- All 12 configurations run the same task in the same job, so comparisons within a task use the same environment.
- One attempt per cell. Retries are warmer by definition, and best-of-N selection would bias quality upward.
Why Kimi K3
We wanted a model that was not native to one of the leading harnesses in the comparison.
Using Claude would favor Claude Code’s native environment; using a GPT model would do the same for Codex. Kimi K3 gave us a more neutral starting point, although it does not remove every compatibility effect.
Kimi K3 is a frontier-class coding model with published token pricing and implicit prompt caching. We served it through Fireworks so every harness reached the same third-party inference backend.
All nine harnesses connect through a single gateway that speaks both the OpenAI Responses API and the Anthropic Messages API, so each harness talks its native protocol to identical weights.
Why K3 gives Kimi Code no home-field advantage
Kimi Code is built by the same lab as Kimi K3, but it did not have a native-path advantage in this evaluation.
Kimi Code’s kimi provider type returned a 404 against our gateway, so we configured it as type = "anthropic" and routed it over the Messages API. Its stream output also omits usage data, which we recovered from usage.record events in the session wire log.
Kimi Code tied for seventh at 56.7%, with a $3.65 median cost per pass and a 7m 56s median runtime. Its 88.0% median cache hit rate tied for the best in the field, but that did not translate into a higher pass rate or lower cost.
Finding: Claude Code’s token-weighted cached hit rate is far low
The leaderboard shows a median cache hit rate, but that number does not describe where the total token spend went.
Claude Code’s cache hit rate is 25.0% token-weighted and 67.8% by median cell. Every other harness in the field sits between 91.6% and 99.1% weighted. The dashboard plots the median; the total token bill is driven by the weighted number. Nothing on a normal leaderboard reconciles the two, and for Claude Code the gap is 2.7x.
The median, 67.8%, describes a typical cell and can be compared with the $18.34 median cost per pass. On that measure, Claude Code’s cache rate was 1.3x lower than Codex’s 88.0%. The token-weighted figure, 25.0%, describes the total input-token volume. It is heavily affected by the most expensive task, where Claude Code cost $64.36 with a 15.7% cache hit rate.
The weighted cache hit rate is heavily skewed: three of Claude Code’s nineteen successful cells account for 88% of its total token usage, and just one task (python-statemachine-state-data-scoping, 24.6M input tokens at a 15.7% hit rate) is responsible for 68% by itself. In effect, the 25.0% weighted cache rate mostly reflects the performance on this single, exceptionally large cell, so it doesn’t represent typical Claude Code behavior.
Why is the weighted rate so low?
One likely contributor is harness-model fit. Claude Code is designed around Anthropic models and their explicit cache-control semantics. K3 exposes an implicit prefix cache with different behavior, so the same caching strategy may not transfer cleanly. This is a property of the complete harness-model configuration, not necessarily a defect in Claude Code.
The trajectories also show that caching was inconsistent from call to call. In one archived Claude Code session, the cache read stayed near 18.4K tokens (the size of the system prompt) on most calls, while the growing conversation was billed at the fresh rate. On roughly one call in five, the same append-only prefix reached a 100% hit rate:
call   fresh   cacheRead   total_in   hit%
   1    1174       18432      19606   94.0
   4   19381       18432      37813   48.7
   5       0       38345      38345  100.0   <-- same conversation, full prefix hit
   8   23092       18688      41780   44.7
  13       0       45277      45277  100.0
  25   35474       18944      54418   34.8
  26       0       55514      55514  100.0
That variation within one append-only conversation is difficult to explain as a stable property of the harness alone. The same prefix was cached in full on some calls and not at all on others, which is the behavior of an implicit cache rather than a fixed caching strategy.
We cannot yet attribute the gap to the harness by itself. The $18.34 and $64.36 figures describe the exact configuration we tested, not Claude Code in isolation. Separating those effects is the first item on the v1.1 list.
An example task
datacurve/python-statemachine-state-data-scoping is a feature request against fgmacedo/python-statemachine at a pinned base commit. Official DeepSWE pass rate: 38%. Median historical trajectory: 117 agent steps.
Solving this means touching the metaclass, the callback injection machinery, history restoration, pickling, the SCXML parser, and the diagram renderer, then keeping the existing suite green. Seven of the 12 configurations passed.
| Harness | Result | Cost | Turns | Cache | Time |
|---|---|---|---|---|---|
| Pi | pass | $2.50 | 90 | 98.2% | 39m |
| Codex | pass | $5.97 | 187 | 99.1% | 37m |
| Hermes | pass | $6.70 | 156 | 99.1% | 29m |
| Kimi Code | pass | $9.24 | 209 | 99.3% | 38m |
| DSH Standard | pass | $10.14 | 227 | 99.3% | 47m |
| DSH Minimal | pass | $10.49 | 259 | 99.1% | 44m |
| Claude Code | pass | $64.36 | 381 | 15.7% | 60m |
| Exo Harness | fail | $1.46 | 51 (cap) | 96.0% | 40m |
| Oh My Pi | fail | $2.71 | 86 | 98.3% | 42m |
| DSH Creator | fail (timeout) | $3.88 | 109 | 98.8% | 60m |
| DSH PTC | fail (timeout) | $12.95 | 285 | 99.5% | 60m |
| OpenCode | fail (timeout) | n/a | 0 | n/a | 60m |
This task is the thesis in miniature. Seven configurations produce the same outcome, a passing verifier, and the receipts for that outcome are nothing alike.
Pi and Claude Code both passed, with a 26x difference in price. Pi reached the fix in 90 turns; Claude Code took 381, and recorded a 15.7% cache hit rate against Pi’s 98.2%. More steps, each one more expensive. The pass/fail column cannot see either effect. The difference belongs to the complete harness-model configuration tested here; the current data cannot isolate each component’s contribution.
DSH PTC spent $12.95 on a failed run, more than six of the seven configurations that passed. DSH Creator failed at $3.88 while DSH Minimal passed at $10.49. Both used the same harness, model, and runtime, but different presets. Creator reached the 60-minute limit, so prompt and tool configuration affected both pacing and outcome.
Limitations and future work
Limitations
FrontierHarness v1.0 is currently limited to software development and terminal-based tasks. It does not yet evaluate other types of agentic or knowledge work. Broader coverage is needed before making general conclusions.
The benchmark uses each harness exactly as it is shipped, without modifying anything inside. For harnesses like Claude Code with strong internal opinions (such as around caching), we do not alter their implementation to improve cache hit rates or to standardize caching across gateways. As a result, the reported cost differences reflect the full harness-model setup as delivered, and we cannot say how much of the gap would remain if every harness were equally tailored to K3’s caching behavior.
Future work
Version 1.1 will add more harnesses and evaluate a broader set of models. Rather than holding the model fixed, we plan to evaluate the full harness × model matrix to reveal interaction effects (which harnesses work best with which models) and produce a harness-model compatibility matrix.
Conclusion
The harness makes a difference. Pass rates in this field cluster within 17 points; median cost per pass spans 17x.
Codex is the safe default: highest pass rate, cost near the field median at $3.47.
Pi is the pick when the same job runs many times and token spend compounds. On our hardest task it landed the same fix as Codex in 90 turns against 187, for $2.50 against $5.97.
Exo is the cheapest per completed task at $1.05, partly because it stops early: on the hardest task it hit its 51-step cap and failed at $1.46 while others kept spending. We did not test retries, but a harness that fails cheaply is the one you would want to retry.
DSH shows how much the preset matters. Its four presets differ by 6.6 points of pass rate and 1.4x in cost on the same model and runtime, which is about the spread between many of the harnesses themselves.
The cost spread across the field comes mostly from the harness-model pairing. Cache strategy, tool looping, and prompt design belong to the pair, not to the harness alone, and a harness tuned for one family’s cache contract can look efficient there and expensive elsewhere. Holding the model, tasks, and runtime constant is what let v1.0 see those effects. Future runs will widen the harness × model matrix and tasks diversity.